In Actual Dollars, Tax Cuts Boost Revenue Time After Time
From the Kennedy legislation in 1964 to the Trump package in 2017, the naysayers are proven wrong again and again
By Jack Salmon
Historically high federal budget deficits and a mountain of debt larger than the entire U.S. economy have made the Build Back Better bill a tough sell in Congress. But proponents claim that if the 2017 tax cuts took a hatchet to Treasury revenue—President Biden says to the tune of nearly $2 trillion—then a bigger budget deficit can also finance the trillions in Build Back Better spending.
One problem: Federal revenue didn’t fall after the big Trump administration tax cuts, much less by $2 trillion. Instead, total revenue rose. In fact, after trimming the rates for five of the seven brackets and nearly doubling the standard deduction, the government collected nearly $100 billion more in personal income tax revenue for the year ended Sept. 30, 2018. That was the biggest jump in three years.
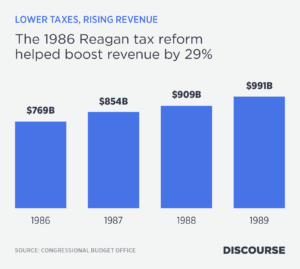
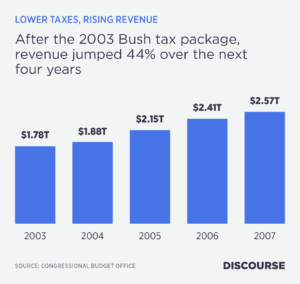
The conventional wisdom in media, political and policymaking circles is that tax cuts cost the government so much revenue that they drive the country’s enormous budget deficits, but this isn’t true. After President George W. Bush’s 2003 tax cuts, revenue rose for the next four years, with the deficit shrinking to as little as $161 billion in fiscal 2007. After the 1986 Reagan tax reform, which cut the top personal income tax rate from 50% to 28% and lowered the rates for other brackets, the deficit plummeted 32% the next year and stayed at that low level for another two years while revenue rose dramatically for three straight years.
Economists in Denial
But most economists, of all people, resist acknowledging this. The University of Chicago Booth School of Business polled 40 prominent economists in 2012, asking whether total federal tax revenue would be higher in five years if income tax rates were cut. Tax revenue has always been higher five years after a cut in tax rates, but not one economist agreed. A few were uncertain, the vast majority disagreed or strongly disagreed, with many sarcastically dismissing the idea in their comments.
Of course, revenue sometimes falls short of estimates of what it might have been if taxes weren’t cut. But these estimates, usually by the Congressional Budget Office, can’t consider the economic slowdowns that may be averted and the pandemics that come out of nowhere. When people in the press or on television talk about tax cuts reducing revenue, they’re talking about revenue compared with what might have been, not in actual terms. They like to talk about budget baselines—straight-line revenue projections that assume nothing will change—and then argue that tax cuts hurt the Treasury because the actual revenue growth didn’t meet the predicted growth.
To be sure, not all tax cuts are created equal. Merely mailing rebate checks to taxpayers, handing out child credits or offering tax breaks to businesses for dubious purposes doesn’t spur long-term economic growth. These Keynesian, demand-side tax cuts can add as much to the budget deficit as the government spends on them.
The Power of Incentives
But supply-side cuts that lower tax rates—for individuals, corporations and capital gains—do spur the economy and boost tax revenue. They offer incentives to people to work harder and invest more, therefore expanding the supply of labor, investment and savings. All big tax-cut packages contain both demand-side and supply-side elements, so they unfortunately never produce all the economic growth and increased revenue that a supply-side-only package would generate.
But no matter the type of tax cut, efforts over the decades to lighten the tax burden have never been the main culprit behind the government’s inflated budget deficits. Recent federal deficits have been driven by pandemic-related legislation, while the long-term fiscal imbalances are driven by the growth of Social Security and other entitlement spending.
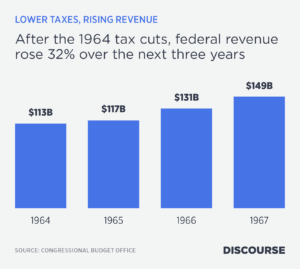
Let’s take a look at the major post-war tax cuts. The first was the U.S. Revenue Act of 1964, which reduced the top personal income tax rate from 91% to 70% and the top corporate tax rate from 52% to 48%. Keynesian economists, as well as skeptical Treasury staffers, estimated that the cuts would result in a cumulative revenue loss of $32 billion by 1966 (in constant 1963 dollars).
But instead, federal receipts grew by 65%, or 32% in real terms, from 1965 through 1970. And a time series analysis published in the years following the act found that it led to a cumulative revenue loss of just $2.5 billion through 1966, compared with the estimate of what revenue would have been without the tax cuts. In fact, the economists who conducted the analysis concluded that the revenue effect was “virtually indistinguishable from zero.”
The First Supply-Siders
The impact of reining in such high tax rates may have surprised many policymakers, but market-oriented economists had long understood their negative effects. Indeed, almost 200 years earlier, Adam Smith wrote in the fifth book of the Wealth of Nations:
“High taxes, sometimes by diminishing the consumption of the taxed commodities, and sometimes by encouraging smuggling, frequently afford a smaller revenue to government than what might be drawn from more moderate taxes.”
Similarly, 50 years later, French economist Jean-Baptiste Say in his “A Treatise on Political Economy” noted that when taxation is pushed to the extreme, “the tax-payer is abridged of his enjoyments, the producer of his profits, and the public exchequer of its receipts.”
Amid a double-dip recession, President Reagan signed the Economic Recovery Tax Act in 1981. This cut the top personal income tax rate from 70% to 50% over a three-year period. Inside-the-Beltway conventional wisdom was again turned on its head as federal receipts grew by 33% in real terms from 1983 through 1989. To this day, the Reagan tax cuts are widely accused of exploding the federal deficit, but the deficit as a share of gross domestic product fell by half during this period. Give much of the credit to slower public spending, which grew by an average of 11.8% a year in the six years before 1981 but by only 7% a year in the six years after 1981.
The Bush tax cuts began with the Economic Growth and Tax Relief Reconciliation Act of 2001, which lowered the top income tax rate from 39.6% to 35%, cut three of the other four rates and created a new, lower, 10% rate. Critics bashed the tax cuts; some economists forecast that they would chop federal revenue by as much as $2.3 trillion by 2011.
Federal revenue did fall after the cuts—which were signed into law when the economy was in recession and three months before the Sept. 11 attacks—but by only $210 billion, or 10.6%, over the next two years. Market-oriented economists see these cuts as poorly designed and largely a failure, given the loss of revenue and the slow economic growth that persisted into 2002. This was because handouts such as tax rebates, expanded child credits, and other credits and deductions made up a big part of the cuts but did nothing to improve incentives to work and invest and so did not spur economic growth, according to a 2012 Mercatus Center report. These were Keynesian provisions, aimed at getting money into the hands of consumers and businesses and goosing demand, and not supply-side cuts that would increase the availability of labor and goods.
Revenue started rising again after Bush’s second round of tax cuts. This 2003 package was better designed and fixed some of the problems with the 2001 cuts, but not entirely.
The latest major tax-cut legislation is the Tax Cuts and Jobs Act of 2017, the Trump tax cuts. They lowered the top rate from 39.5% to 37% and sliced the top federal corporate tax rate from 35% to 21%. The Joint Committee on Taxation estimated that compared with the budget baseline, the act would reduce revenue by almost $1.5 trillion over the next decade. For fiscal 2021, the committee said revenue would fall $198 billion short of the baseline, but instead it came in $39 billion higher. Overall, revenue has jumped $685 billion since the tax cuts, as of the end of fiscal 2021, rising every year except for a slight drop during the 2020 pandemic year.
Here’s another way to look at this package: As of 2020, revenue since 2017 as a share of GDP was half a percentage point a year below the average for 1950 through 2017, while expenditures were 12.3 percentage points a year above the historical average. But from 2021 onward, revenue is forecast to exceed the average, while expenditures are forecast to significantly exceed the average and by a growing margin. This signals not a revenue shortfall but a serious overspending problem.
In a new research paper, Charles Blahous tabulates legislated contributions to the government’s fiscal imbalance. With the fiscal 2021 budget, he finds that 66% of the deficit was rooted in pandemic-related spending and 25% caused by pre-2017 legislation. Just 7.8% was the result of lost revenue—money the government might have collected if the Trump tax cuts hadn’t been enacted and the economy would’ve performed as well as it did with the tax cuts. Looking at the long-term fiscal imbalance, he determined that 83% of the deficit is due to spending growth (especially with Social Security and Medicare and other government healthcare programs), while 16.8% is the result of tax cuts over several decades.
The lesson here isn’t that tax cuts don’t ever add to the deficit—those Keynesian ones certainly do—but that they don’t deserve anywhere near the blame they get for those deficits. The federal government doesn’t have a revenue problem; what it does have is a terrible addiction to spending.


