Has COVID led to “urban flight?”
Until more data are available, it will be hard to know whether the pandemic has made city living less attractive
By Salim Furth
The first U.S. epicenter of the COVID-19 contagion was our biggest, densest, most global city, New York. As New Yorkers belatedly grasped the threat, thousands temporarily left the city to stay in second homes or with family members elsewhere. Ever since, there’s been a persistent belief that 2020 has seen a widespread urban exodus. That belief, however, is predicated on devilishly little data. What data we do have suggests that buyers believe the long-term prospects for American cities remain strong, regardless of what’s occurring at the moment.
It’s always been hard to find good data on short-term migration trends. In 2020, migration researchers have become detectives, using trash pickups, cell phone location pings and USPS change-of-address forms to try to piece together a complete story. But much of the information does not readily distinguish movers from travelers, and it’s usually only available with several months’ lag. Even worse, the pandemic has drastically worsened some standard data sources because in-person interviews have been curtailed.
One fact that clearly emerges from the data is that Manhattan and San Francisco have experienced serious population outflows. It’s easy to come up with reasons: the crowding, the prices, the prevalence of residents who own country homes, the closure of marquee cultural amenities. But if we look at the next tier of pricey, dense, elite cities—Boston, Washington, Seattle, even the outer boroughs of New York—it’s unclear if there’s been any significant population outflow.
It’s easier to find data on home sales, which can potentially tell us where housing demand is rising and falling. An August report by Zillow gave strong evidence that urban and suburban housing markets moved in lockstep at least through early July, further contradicting the prevalent belief in urban flight.
Using Zillow’s publicly-available data, I was able to find similar patterns through October. Notably, single family home prices really took off in August. The price boom is national, and it’s undeniable that it’s aided by historically low interest rates and a sharp decrease in the number of houses on the market. I divided the country into five regions that have experienced coronavirus outbreaks at different times and looked at the acceleration of housing prices in urban and suburban ZIP codes. (Acceleration equals current month’s year-over-year price change minus February year-over-year price change). In California and the Northeast, suburban markets have accelerated slightly faster; in the three other regions, urban ZIP codes have actually been in the lead.
But there’s a big disconnect between home values and rental markets. Zillow uses a different methodology for rentals, so the two series aren’t directly comparable. (And my own calculations are imprecise because I don’t have the proper weights to attach to each ZIP code).
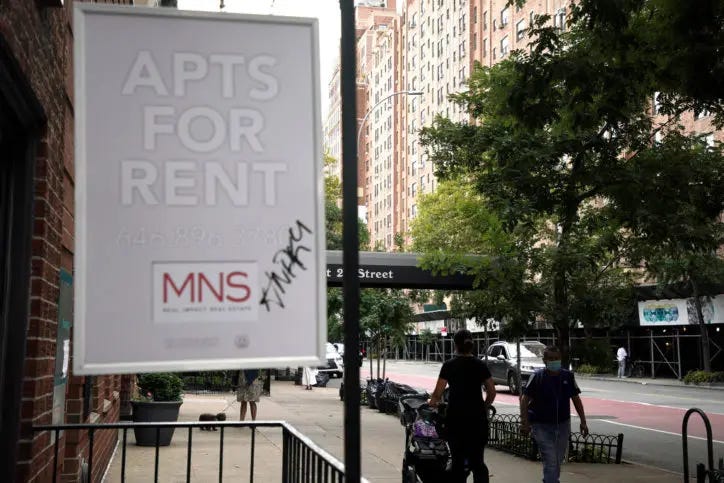
With rent, there’s a clearer distinction: suburbs had a price deceleration but recovered, while cities in most regions have not yet experienced the recovery. The difference is quite large in California and the Northeast. And the usual suspects stand out. Of the 25 ZIP codes with the largest decelerations in rent, 14 are in Manhattan, 4 in San Francisco and 2 each in Brooklyn, Boston and Seattle.
In a New York Times article last week, economist Issi Romem explained why quicker sales and fewer people selling one home to buy another contribute to a frenzied housing market. At first glance, one would think these are neutral changes: a family selling one home and buying another contributes equally to supply and demand. And each completed sale reduces supply and demand equally. But those equal reductions in supply and demand intensify any imbalance in the remaining market. In 2020, that has boosted the underlying seller’s market. If the underlying market were favorable to buyers, quicker sales and fewer movers would increase the price cuts and concessions.
Taken together, falling rent and rising home prices could be telling two stories, both of which are plausible. First, the data suggest that the long-term prospects for housing demand (reflected in purchase prices) are excellent even though short-term demand (reflected in rents) is soft. Second, the data are consistent with the unequal impact of the COVID recession, which has spared most high earners (who mostly buy homes) while hammering low earners (who mostly rent).
The rent data are also consistent with short-term urban flight, but the home price data from urban areas contradict the breathless stories predicting the death of cities. Until more data is available, we will not fully understand the extent or the duration of urban flight.
Meanwhile, for local governments in both urban and suburban areas, an era of unknowns calls for a higher degree of flexibility. Regulations and spending priorities are implicitly set, in most cases, to support and maintain existing patterns. That’s not always good—for example, exclusionary zoning perpetuates past injustices—but at least it can be sustained. The pandemic, however, has shaken up and changed a lot of things, and some of that change will stick. For example, there will almost certainly be more remote work and fewer retail stores in 2022 than there were in 2019.
Local policies interact with economic reality like a ratchet: zoning can prevent construction, but it cannot stop abandonment. The lack of infrastructure can limit economic activity, but the existence of unneeded infrastructure does not generate its own demand.
Thus, localities with rigid development regulations and budgets will find that they miss out on the positive changes but cannot avoid the negative ones. Community leaders should embrace, or at least tolerate, an era of unavoidable change and increase flexibility in their land use, business and transportation policies.


