Downtowns and Transit After the Pandemic: An Update
Hybrid work schedules are having dramatic effects on metropolitan land use and transit
By Michael Arnold
Two-plus years of the pandemic have had major effects on the economy, and one of the most important and long-lived will be the effect on the “structure of work.” Despite lockdowns and concerns about spreading the virus in close quarters, many office workers remained employed during the worst months of COVID. Why? They were allowed to work at home, remotely. And the big change coming is where these employees will work once the economy has settled into a “post-COVID” world.
Remote work and “hybrid” work schedules, in which employees go to the office 2-3 times a week but otherwise work from home, are being implemented in offices across the country. These schedules will ultimately define how much of their 40-hour week office workers (broadly defined) spend in the many commercial office buildings scattered throughout the metropolitan U.S. If this turns out to be only two or three days a week, the impacts could be substantial on the number of workers in commercial office buildings on weekdays, on public transit ridership and on retailers serving central business districts.
Remote work that was facilitated by digital technologies such as Zoom and Google Meet became prevalent during the height of the pandemic. Lockdowns and fear of spreading the virus forced the hands of employers. Workers who could continue to work remotely did so.
Given the amount of time workers have already been remote, employers have learned whether their employees are as productive virtually as they were in downtown or suburban office buildings. Simultaneously, employees working from home have learned “by doing” their preferences for the new working arrangement.
Surveys of employer and employee work experience and preferences during the height of the pandemic indicate that this new working structure is here to stay. Some polls are conducted by business organizations such as the San Francisco Bay Area Council, others by consulting firms such as Price Waterhouse or McKinsey. Still others occur as federal agencies, such as the Bureau of Labor Statistics, attempt to count the economic impacts.
For instance, the Bureau of Labor Statistics in March published new tables based on a survey of establishments in 2021. Combining that data with supplemental questions added to the Current Population Survey, the researchers concluded:
Between July and September 2021, 13 percent of jobs in U.S. private sector businesses involved teleworking full time and 22 percent involved teleworking at least some of the time. One-third (33 percent) of establishments increased telework for some or all employees during the COVID-19 pandemic.
They also reported:
Telework was also associated with reductions in workplace square footage and relocation: the share of establishments that increased telework was larger among establishments that reduced square footage or relocated during the pandemic.
Figure 1 below shows the percentage of employees working remotely by industry and for all industries. As expected, for those industries with a larger proportion of “office jobs,” there is a greater proportion of employees working remotely. Information, professional and business services and financial industries show very high proportions of remote employees. By contrast, those industries requiring direct interaction with customers (e.g., food services and accommodations) and those industries with many jobs that can’t be performed at home (e.g., natural resources and mining) provide far fewer opportunities for remote work.
Figure 2 below demonstrates how far-reaching remote work has become. While there are variances by jurisdiction—Washington, D.C., with its many government-related offices, has the highest percentage of remote workers by far—even in the state with the least amount of remote work (Mississippi), a quarter of the establishments responding to the survey offered either full-time or (far more prevalent) hybrid work schedules.
Impacts on Transit Ridership
Transit ridership data are published monthly by the Federal Transit Administration for every transit operator in the country by “mode” or type of service. The evidence is overwhelming that transit agencies are in a world of hurt, affected first by lockdowns and fears of occupying a public vehicle, but now by remote work.
Figure 3, in two parts, plots national transit ridership (i.e., one-way boardings) by major mode. Local transit operators may claim ridership is returning, but the data tell a different story. Yes, ridership has rebounded from the dramatic declines in spring 2020, when lockdowns reduced ridership by 80%. However, more than two years later, transit ridership is still down almost 40%. Commuter rail ridership is down 50%, carrying half the riders it did in 2019. And these numbers are not minor: In April, total transit boardings were 313 million below 2019 levels.
How widespread is the decline in transit use? Figure 4 plots transit ridership for selected metropolitan areas. As the data demonstrate, trends across the country are more similar than they are different.
The financial consequences of the ridership declines have yet to be fully recognized. All public transit operators are subsidized, some far more than others, from either local and state tax revenues or toll revenues. The three federal COVID relief bills—the CARES act of March 2020, the Consolidated Appropriations Act of December 2020 and the American Rescue Plan Act of March 2021—provided $69.5 billion dollars for transit operations in the past two years. But the bailouts for operations have now ended. The infrastructure bill recently passed by Congress funds capital extensions with relatively minor funding for operating expenses. As the American Public Transportation Association reported in November 2021, “[T]he demand for transit in urban centers, on which transit operators have historically relied, could be permanently reduced.”
And what will the transit agencies do in the coming year or two? An early sign occurred in November 2020: The Peninsula Joint Powers Board, which operates Caltrain in San Francisco, San Mateo and Santa Clara counties, passed a one-eighth-cent sales tax (Measure RR) to pay for commuter rail operations, easily surpassing California’s two-thirds vote requirement to raise taxes.
Effects on Commercial Office Building Occupancy in U.S. Downtowns
With fewer people working 40 hours per week in downtown office buildings, the effects on city centers are obvious. While employment has nearly reached the high level of February 2020, data on office entries and office vacancy rates are consistent with the story about consequences of remote work. Employed office workers are spending more time remotely, and employers are recognizing they need less floor space to house them.
Kastle Systems is the largest provider of access control systems for commercial office buildings in the nation and has published counts of those entering offices for 10 metropolitan areas, dubbed the “Back-to-Work Barometer.” Data are reported in figure 5 below, and the lines are amazingly similar to the transit ridership data in figures 3 and 4. Based on Kastle’s measure, workers are slowly returning to offices in the markets tracked, but they’re still far below the numbers entering buildings in February 2020, prior to the pandemic.
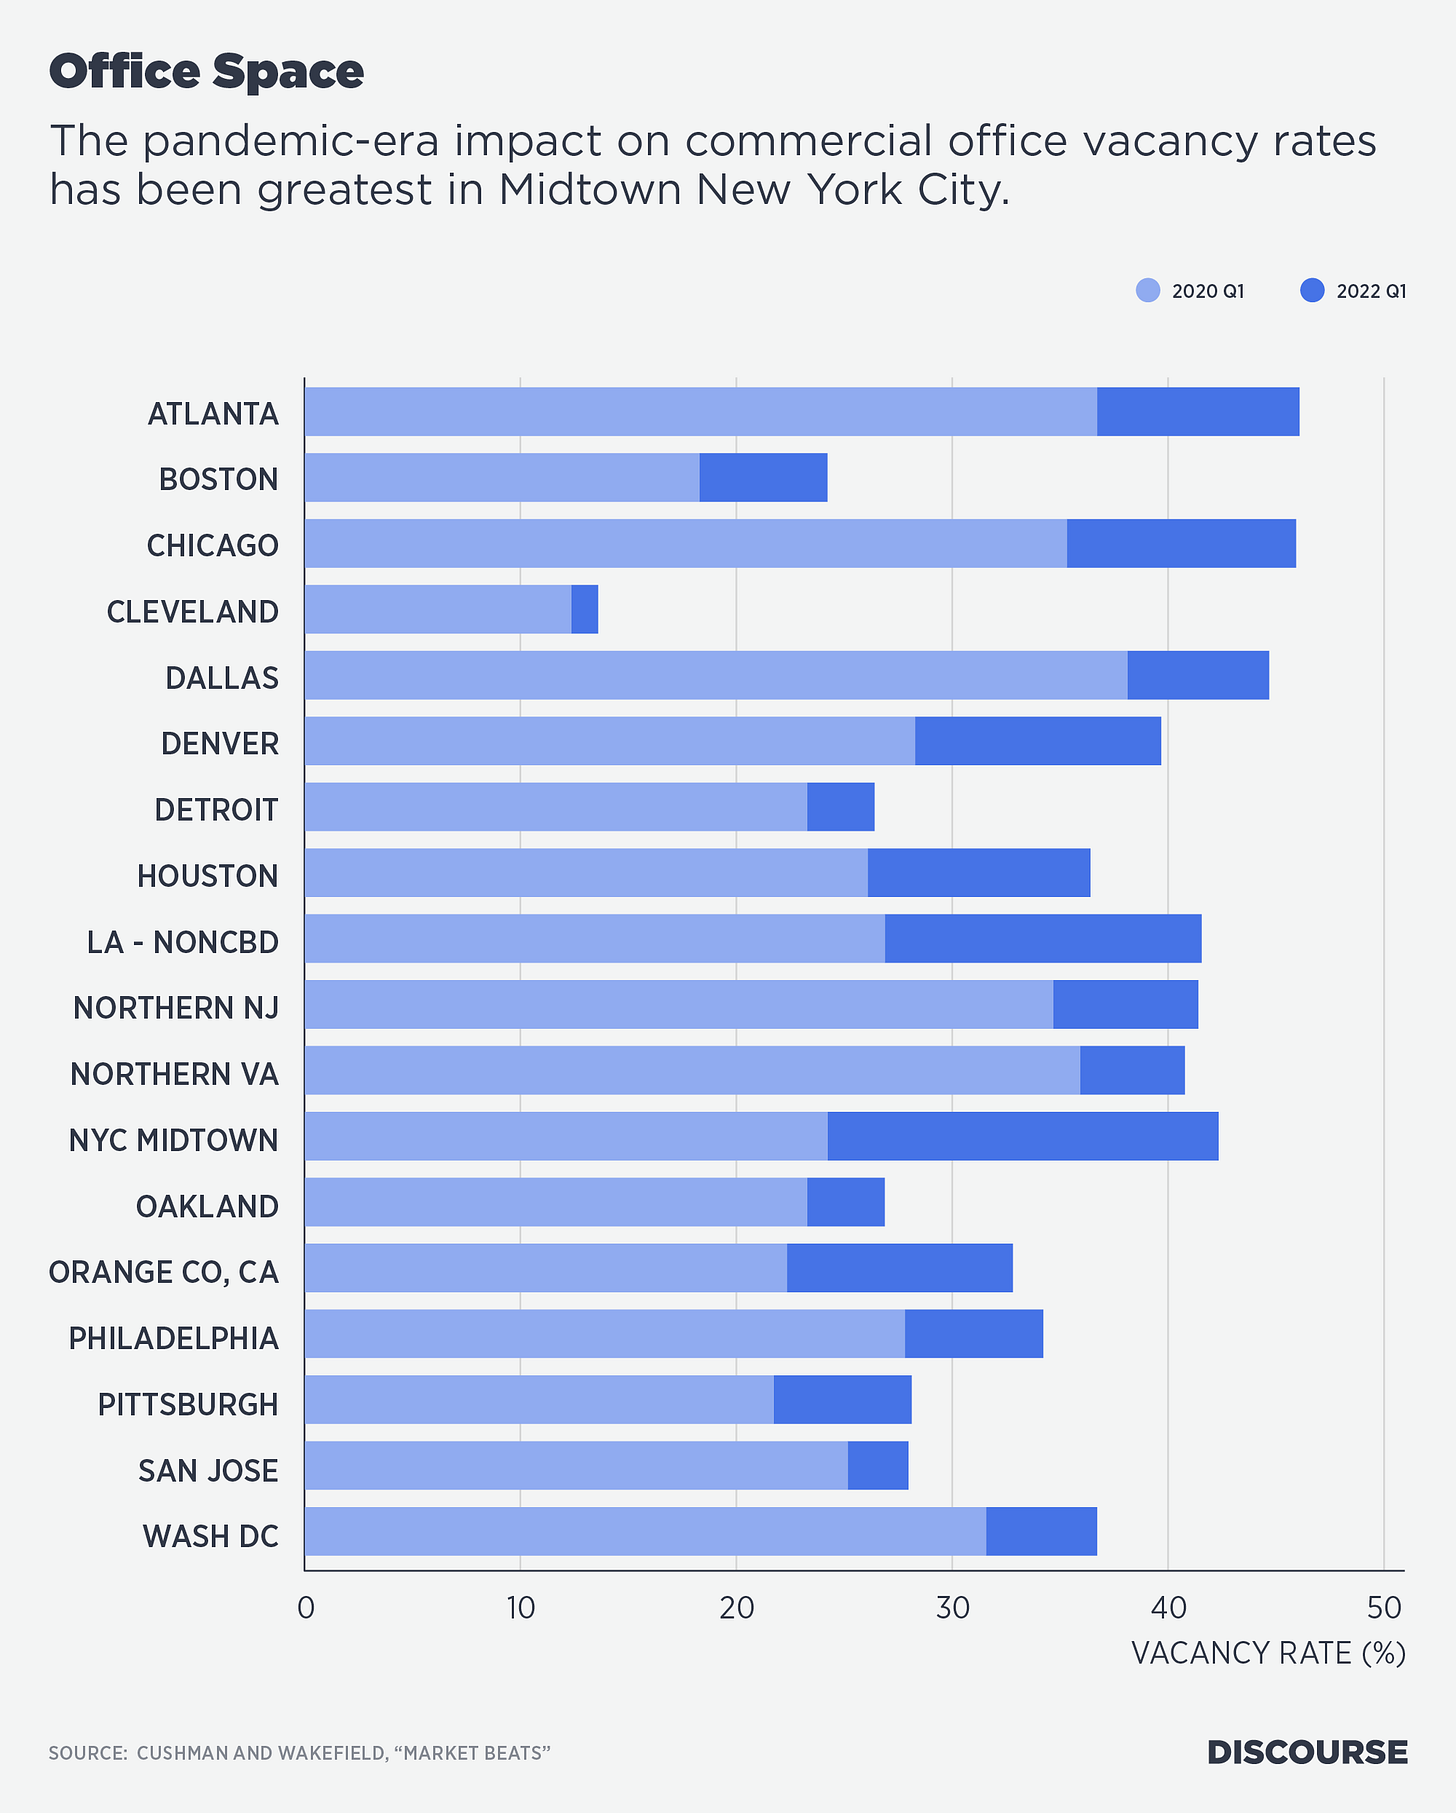
Commercial real estate services company Cushman and Wakefield reports quarterly vacancy rates for 90 “office markets” in the U.S. The largest 17 markets comprise about half the total inventory contained in the company’s measure of commercial office floor space in the nation. As shown in figure 6, vacancy rates are higher now than they were in the first quarter of 2020, when lockdowns occurred and workers fled downtown areas. Vacancy rates have increased in 85 of the 90 office markets tracked.
I previously reported that the national office vacancy rate had reached 14.4% in the third quarter of 2020, the highest level in six years. A year and a half later, Cushman and Wakefield reported the national rate had reached 17.5%.
Will vacancy rates increase further? Office leases may last longer than a year, and companies are adjusting their work schedules. The implication is that vacancy rates in commercial office markets are sure to increase, even as some workers return at least some of the time to their offices.
In my prior article, I stated:
Within a year, after widespread distribution of the vaccine and the anticipated ebbing of the pandemic, we should know whether much of the workforce has relocated for good.
While the pandemic has not yet ended, it is evident that people’s health concerns about riding in transit vehicles are receding, and more workers are returning to offices at least partially, because transit ridership has increased somewhat in the past year and a half.
But until ridership returns to pre-pandemic levels, vacancy rates will continue to be high, and U.S. downtowns will feature many more “for lease” signs as local retail businesses are challenged by the decline of daily population in the commercial buildings.
And what if a recession occurs next year, as some forecasters think? One can only imagine how a recession that reduces employment generally interacts with the structural changes to labor markets brought about by the intersection of the pandemic with the digital revolution. Certainly, such a recession will further stress the nation’s downtowns and the transit systems that bring workers to central business districts.


